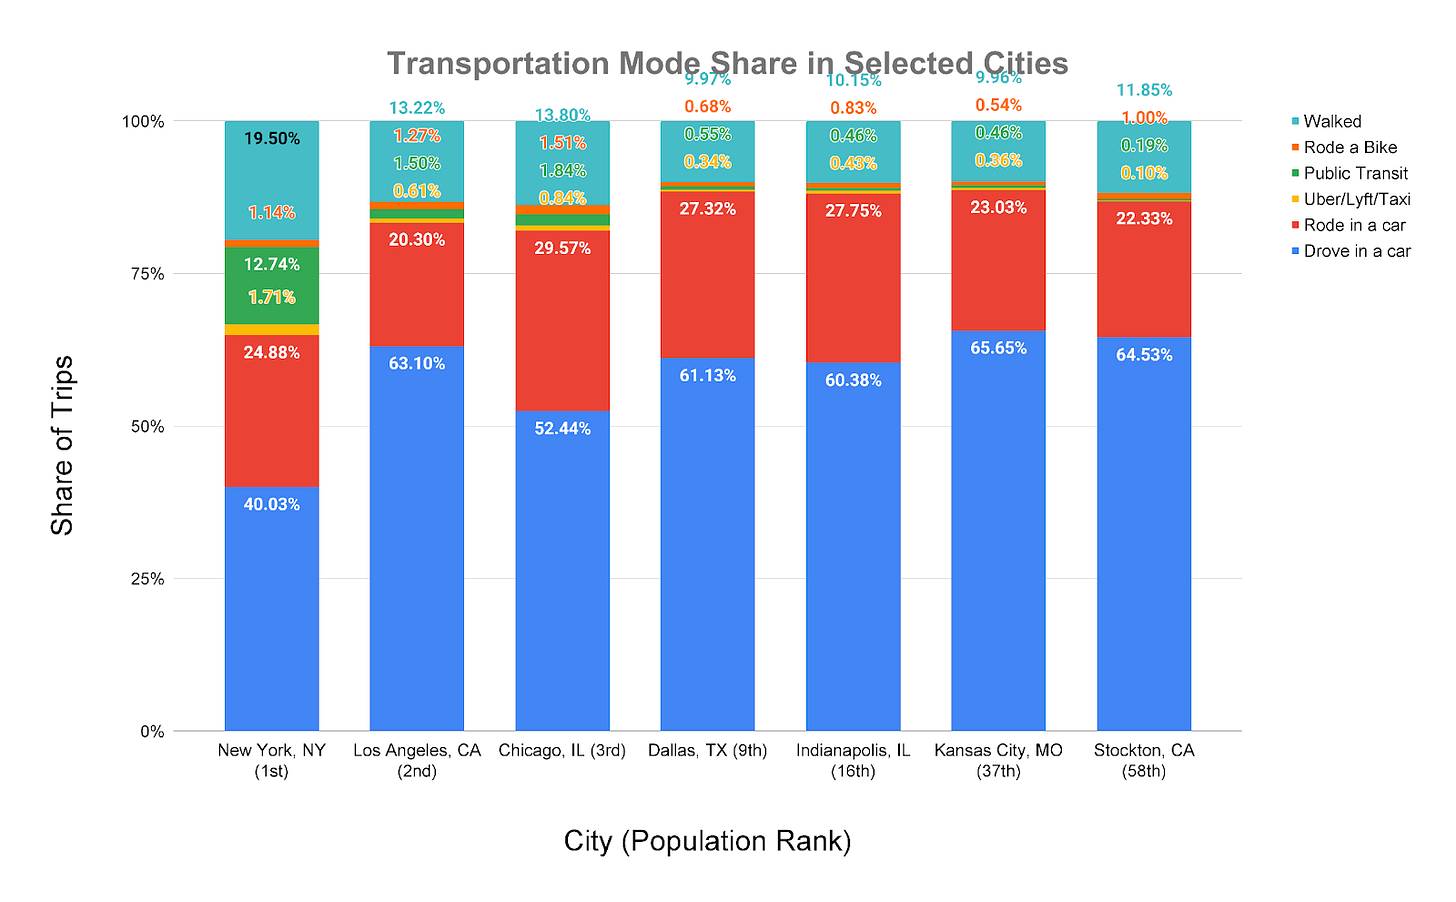
Hey, transportation planners. For most people, transportation is just to get from point A to point B. While a dedicated few (myself included) think about and attempt to actively influence how people make transportation choices, most people just opt for whatever gets them there the quickest, safest, most conveniently, and (ideally) most cost effectively. Unfortunately, a century’s worth of active decisions (and concessions) related to land use, infrastructure, and public spending (made by people like me, before me) have made driving alone the logical transportation choice for most people, and it shows in mode share. The below chart shows the modal breakdown (the share of people that drove vs walked vs bikes vs took transit) for all trips taken within an assortment of cities of different sizes.
Source: Replica, Spring 2023
While the choice to drive for most, if not all trips often makes sense on the individual level, it aggregates to a system that undermines our collective environmental, economic, and social sustainability. In my experience, urbanists and sustainable transportation people (me and my peers) have a tendency to lead with the "Cars are evil! Ban cars!" mantra without taking the time to explain why. However, for most of the population, driving is akin to personal freedom, and any suggestion that it should be limited can be received as a direct threat to their way of life. I think this scorched earth approach can have an alienating effect on people that are interested in, and potential advocates for sustainable transportation, but don’t live in a reality where getting rid of their car is feasible. This article is my attempt at explaining at a high level the sustainability argument for moving away from cars as the primary assumed mode of transportation in a way that is (hopefully) approachable and compelling. If you’re in the transportation industry, you have probably heard and engaged with most of the arguments that I will make in this post, but I still hope you can get something out of this article. If we want to move the needle on sustainable transportation in a positive direction, we need to be comfortable having informed (potentially likely uncomfortable) conversations about the costs of auto dependence in a way that fosters mutual respect and acknowledges that people just want to get where they need to go. I hope you enjoy reading! As always, feel free to leave any comments on this article!
Note: This post is a little longer and drier than I expect future posts here to be, but I think this topic is expositionally important.
Defining Sustainability
Before discussing the sustainability of driving, I think it is important to detail how I define sustainability. Our Common Future (aka, the Brundtland Report) defines sustainable development as “development that meets the needs of the present without compromising the ability of future generations to meet their own needs.” The definition of sustainability I subscribe to is distillation (oversimplification?) of this definition. In short, if it’s not scalable, it’s (probably) not sustainable. I think this interpretation is particularly true for issues related to public policy. Beyond this broad definition, I think sustainability needs to be measured across three broad categories:
Environmental Sustainability: Is this scalable without causing undue, irreparable harm to the natural environment?
Social Sustainability: Is this scalable without causing undue, irreparable harm to others?
Financial/Economic Sustainability: Does this present expenses and externalities that can be reasonably supported (by individuals or institutions).
With this definition of sustainability in hand, let’s explore the sustainability of driving.
Environmental Sustainability of Auto Reliance
The environmental argument for moving away from driving as the assumed primary mode of transportation is probably the most broadly understood and discussed, so I won't spend much time discussing it. According to the 2022 Greenhouse Gas (GHG) Emissions inventory conducted by the Environmental Protection Agency, the transportation sector is the largest contributor of GHGs in the United States, making up 28% of total contributions. Of this 28%, over half (57%) comes from light-duty vehicles (cars, trucks, and SUVs). The following charts further detail this breakdown.
In response to this, Electric Vehicles (EV) are often touted as the ultimate panacea. Although electric vehicles (the in vogue transportation solution to environmentalism) reduce greenhouse gas emissions by eliminating tailpipe emissions (a significant environmental improvement) all the other environmental harms associated with single occupancy vehicles (i.e. sprawling land use, particulate matter, etc.) plus some new ones (i.e. increased demand for lithium mining) remain with a transition to electric vehicles alone. Electrification is important, but making it easier for people to leave their car altogether should be the policy objective.
Social Sustainability of Auto Reliance
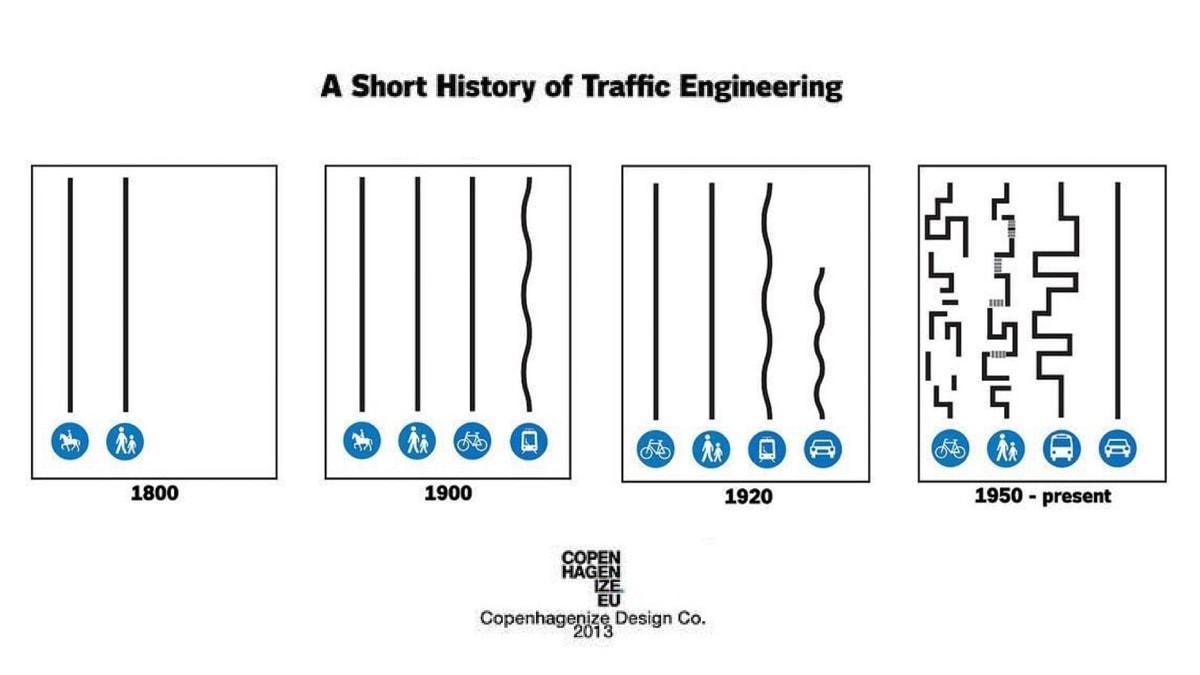
Pedestrian safety is one of the major problems associated with an automobile-oriented development pattern. Before the mass adoption of the automobile, people had to live near the things they needed. This meant that most people walked as a primary means of transportation, and urban areas were built at a human scale, with pedestrians free to occupy the space they required. The mass adoption of the private automobile constituted a mass reorganization of urban space, with the quick movement of cars becoming the new priority.
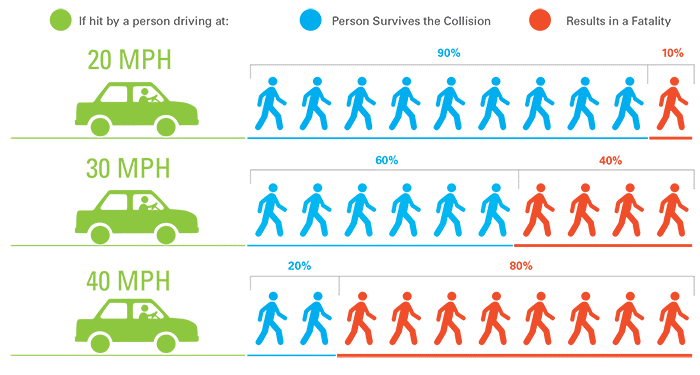
Unfortunately, this reprioritization does not reconcile with a simple reality of pedestrian safety; speed kills. The Institute of Transportation Engineers created the infographic shown below, which estimates the likelihood that a pedestrian would survive when hit at various speeds.
Source: Institute of Transportation Engineers
Between 30 mph (the statutory speed limit in Illinois) and 40 mph, the chance of a pedestrian surviving being struck by a car drops from 60% to 20%. Different studies place the cutoffs slightly differently, but the conclusion remains consistent. The faster someone is driving their car, the less likely they are to stop for a pedestrian, and the less likely the pedestrian is to survive being hit by the driver with the 30-40mph range representing a critical inflection point. (Note: EV’s are typically 15-30% heavier than their gas powered equivalent, so this range will likely decrease as more EVs enter circulation).
We can quantify how this sad reality is playing out across the nation. According to the Center for Disease Control and Prevention (CDC), 37,595 Americans died in car crashes in 2019 (103 people per day). Of these deaths, nearly 1 in 5 (20 people per day) were pedestrians outside of the car. In 2020, this figure increased to 40,698, despite overall levels of driving decreasing during the Covid-19 stay at home orders.
Even more disturbingly, this burden is not born equally across all racial groups. Hispanic people, Black people and American Indians are more than twice as likely as white people to die as a pedestrian in America (here’s a Smart Growth America article with a more fleshed out demographic analysis of pedestrian fatalities) .
This burden is also not equally borne around the country. Sun belt cities that have been built around the car have the highest pedestrian fatality rates in the United States. Additionally, assuming driving as the primary mode of transportation limits the mobility of those who can’t (or chose not to) drive. This group includes children under age 16, older adults, and people living with disabilities, amongst others. According to American Community Survey (ACS) Data, while over 90% of the general population can drive, just over 60% of the population living with a disability can drive. Our current paradigm makes vehicle ownership the cost of admission to participate meaningfully in society, and leaves behind those that can’t bear that cost.
Other Sources on the Social Sustainability of Driving
Pedestrian Safety
“Right of Way” by Angie Schmitt
Safe Street Design
Financial/Economic Sustainability of Auto Reliance
Speaking of costs, vehicle ownership is expensive. For most households, housing is their largest expense. The second largest expense? Transportation. The Center for Neighborhood Technology’s Housing + Transportation Index provides estimates of the average annual cost of owning and operating a vehicle in various locations. The table below details the cost for a selection of cities ranked by population size.
The index estimates the annual cost of vehicle ownership in Chicago, IL to be approximately $10k in the city. By contrast, the annual cost of taking transit in Chicago is between $1k and $4k and the cost of biking is even less at about $300. Consider what you could do with an extra $6-10k per year. Consider what your friend or family member that is struggling to make ends meet could do with an extra $6-10k per year. Again, our current paradigm makes vehicle ownership the cost of admission to participate in society, and leaves behind those that can’t bear that cost.
Other Sources on the Financial/Economic Sustainability of Auto Reliance
“The High Cost of Free Parking” by Donald Shoup
“New Mobilities” by Todd Littman
So What Now?
Now that I’ve taken you through the highlights reel of why driving is bad, and made you feel awful about yourself for driving, my work here is done (I’m joking). In all seriousness, the ugly truth is that:
Driving is the primary way most people get around
People make the choice to drive because driving is the most convenient option for most trips
This reality is unsustainable
If we want an alternate reality that is more sustainable, we have to make walking, biking and transit the convenient option for more trips. I’ll make my best attempt at explaining how to do that in future articles.
1 Based on Replica location-based service (LBS) data, Chicagoans take an average of 3.4 trips per day (for simplicity, this figure will be rounded up to 4). This figure can be used to assume the annual cost of transportation for Chicagoans that bike and take transit. The Chicago Transit Authority’s (CTA) base fare is $2.50 per trip for regular passengers, and $1.25 per trip for reduced fare passengers. Additionally, their monthly pass is $75 for regular passengers, and $35 for reduced fare passengers. This means someone that takes CTA exclusively and pays regular fares should expect to spend $900 to $975 annually if they purchase monthly passes and $3,650 annually if they pay per trip. Someone paying reduced fares should expect to spend $420 to $455 annually if they purchase monthly passes and $1,825 if they pay per trip. For the most expensive option (full fare, paying per trip), this is 36% of average private vehicle spending in Chicago.
2 In his report “Evaluating Active Transportation Benefits and Costs,” transportation economist Todd Litman estimates that “A $500 bicycle ridden 3,000 annual miles needs about $100 annual maintenance and lasts 10 years” (Litman, 40). Estimates vary but few put the annual cost of cycling over $300.


